Plant materials and terpene extract Preparation from Cannabis sativa flower (TCF)
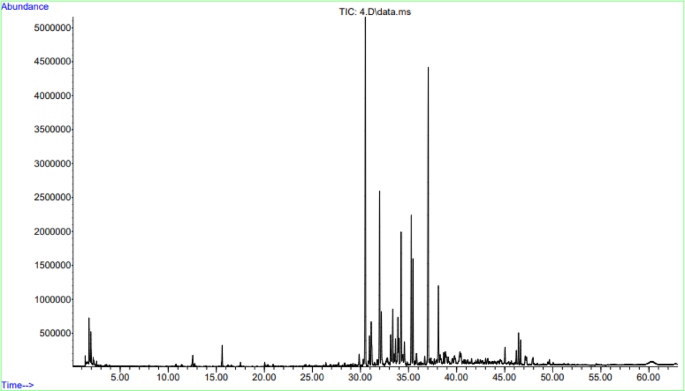
Cannabis sativa flower was collected from Andong-si, Gyeongsangbuk-do, Republic of Korea, in February 2024, and provided by Sangsang Farm. The plant species were identified by Dr. Buyng Su Hwang in Nakdonggang National Institute of Biological Resources, Republic of Korea. A voucher specimen (MCO-NP-D0004) has been deposited at the Library of Natural Products Research Institute, Korea Institute of Science and Technology. TCF (321.06 g, dry weight) was extracted using EtOH at room temperature. The EtOH extracts were evaporated in vacuo to obtain a dark brown residue, which was then partitioned using gradient Si gel column chromatography with ethyl acetate and hexane. The solution was then concentrated in vacuo to obtain a white residue (249.2 mg). The constituent analysis of TCF was performed using gas chromatography-mass spectrometry (GC-MS) according to the following conditions: Capillary column (60 m × 0.25 mm), chromatographic furnace temperature (60 °C, 2 min; 60–150 °C, 3 °C min− 1; 150–180 °C, 1 °C min− 1; 180–220 °C, 5 °C min− 1; 220 °C, 5 min), injection and detector temperature (25 °C), flow rate of carrier gas (1 mL min− 1), sample size (0.2 µL), and split ratio (100 : 1).
Melan-a cell culture
Melan-a cell line (Sigma Aldrich, St. Louis, MO, USA) was cultured in Roswell Park Memorial Institute (RPMI) 1640 media (Gibco, Carlsbad, CA, USA) containing 10% fetal bovine serum (HyClone Laboratories, Logan, UT, USA), 1% penicillin/streptomycin (HyClone Laboratories), and 200 nM phorbol 12-myristate 13-acetate (PMA, Sigma Aldrich). A total of 1 × 10⁵ cells were cultured in 60 mm dish plate and then incubated at 37 °C with 5% CO2.
Cell viability
Melan-a cells (4 × 10⁴) were seeded in each well of 96-well plate with Roswell park memorial institute (RPMI) media containing 200 nM PMA and incubated for 24 h. Various doses of TCF (3.9–1,000 ppm) were applied to the cells for 72 h. The media was then removed, and RPMI media containing 0.5 mg/mL 3-(4,5-dimethylthiazol-2-yl)-2,5-diphenyltetrazolium bromide (MTT, Sigma Aldrich) was added to each well, followed by incubation for 1 h. Dimethyl sulfoxide was then added to the wells and the absorbance was measured at 560 nm by using microplate spectrophotometer (Bio-Tek Power Wave XS, Winooski, VT, USA).
Melanin content assay
Melan-a cells (4 × 10⁴) were cultured in each well of a 96-well plate with RPMI media with 200 nM PMA and incubated for 24 h. TCF (3.9–31.3 ppm) were applied to the cells for 72 h. The media was then removed, and 6 N NaOH was added to the wells and incubated for 30 min at 85 oC. The absorbance was measured at 490 nm using the spectrophotometer. Melanin content per live cell was calculated using the following formula:
Melanin content per live cells (%) = (Melanin content (Abs at 490 nm)) / (Cell viability (Abs at 560 nm)) × 100.
Tyrosinase activity assay
A tyrosinase activity inhibition assay was conducted using L-DOPA as substrate to assess the inhibitory effect of TCF against tyrosinase activity. In a 96-well plate, the assay was performed in four reaction mixture groups; A, 132 µL sodium phosphate buffer (0.1 M, pH 6.8), 20 µL mushroom tyrosinase (1,500 U/mL), 20 µL TCF (3.9–1,000 ppm), and 88 µL L-DOPA; A’, Mushroom tyrosinase replaced with 20 µL sodium phosphate buffer in A; B, Sample replaced with 20 µL sodium phosphate buffer in A; B’, Mushroom tyrosinase replaced with 20 µL sodium phosphate buffer in B. The total volume of each group was 220 µL, and the final concentration of L-DOPA was 1.5 mM. Tyrosinase and reaction mixtures without tyrosinase were prepared followed by preheating for 10 min at 37 °C, respectively. The preheated tyrosinase was then applied to the reaction mixture after incubating for 20 min at 37 °C using a microplate reader with shaking for 1 s every 30 s. After 20 min of incubation, the absorbance was measured at 490 nm. The tyrosinase inhibition activity was calculated as follows:
Tyrosinase inhibition activity (%) = 100 – ((Abs A – Abs A’) / (Abs B – Abs B’)) × 100.
Western blotting
Melan-a cells (1.6 × 10⁶) were cultured in 60 mm dish plates with RPMI containing 200 nM PMA for 72 h Selected concentrations of TCF (7.8, 15.6 and 31.3 ppm) were applied to the cells for 72 h. Cells were then harvested using a scraper (Sarstedt, Nümbrecht, Germany) and protein extraction reagent (iNtRON Biotechnology, Seoul, Korea) containing a phosphatase inhibitor cocktail and protease. Protein concentration was determined using a BCA protein assay kit (Thermo Fisher Scientific, IL, USA). Appropriate amounts of protein were separated on a 10% sodium dodecyl sulfate-polyacrylamide gel and subsequently transferred onto polyvinylidene fluoride membranes. Then, the membranes were sequentially blocked with 5% skim milk solution (dissolved in Tris-buffered saline containing 0.05% Tween 20) and probed with primary antibodies against p-PKC, MITF, TRP1, TRP2, phospho-Ca2+/calmodulin-dependent protein kinase II (p-CAMKII), CAMKII, phospho-p38 MAPK (p-p38), p38, phospho-extracellular signal-regulated kinase (p-ERK), ERK, phospho-signal transducer and activator of transcription 3 (p-STAT3), STAT3, phospho-protein kinase A (p-PKA), PKA, phospho-protein kinase B (p-Akt), Akt, and Glyceraldehyde 3-phosphate dehydrogenase (GAPDH) at 4 °C for 15 h. The membranes were incubated with appropriate secondary horseradish peroxidase (HRP)-conjugated antibodies. Each protein band was detected and visualized using the iBright CL1000 system (Thermo Fisher Scientific). The antibodies used for western blotting are listed in Table 1.
Statistical analysis
All statistical analyses were performed using IBM SPSS Statistics 24.0 for Windows (SPSS Inc., Chicago, IL, USA). Differences between means were analyzed using one-tailed analysis of variance (ANOVA), followed by Tukey’s post-hoc test. Statistical significance was set at p < 0.05.