The work presented here captures natural variation of Total THC (potency) in dried cannabis. The analysis was three-fold: (1) single strata sampling using samples from the top of the plant to investigate how representative single value potency percentage reporting is of an entire cultivar batch, (2) top, middle, and bottom bud sampling to investigate the extent of potency variation across a single dried cannabis plant (and how representative a stratum was of the other strata), and (3) plant versus plant sampling from the same batch to investigate the extent of the potency variation across plants (and how representative a plant was of other plants in the same cultivar batch). At all levels of analysis, the variation in potency ranged from a minimum of 2.4% to a maximum of 6.7% of THC.
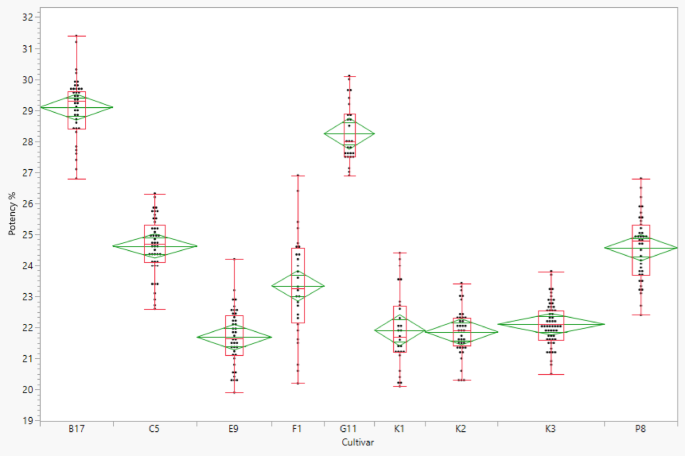
For the single stratum analysis, 30–41% of individual replicates were within the 99% CI diamonds. As the sampling performed was random and sample sizes were ≥ 30, these 99% CI ranges can be considered good estimations of the population mean due to the central limit theorem. If 30–41% of Total THC values are within this limit, the rest cannot be considered a good representation of the mean as stand-alone values. This could be seen as problematic, as even though these are observed potency values and are representative of what is possible from a cultivar batch, depending upon sampling and the extent of variation within an individual cultivar batch, repeated testing of different samples using different methods could be expected to yield different results.
For the multiple strata analysis, plants were stratified into top, middle, and bottom. The top and middle strata were consistently higher in potency than the bottom stratum. Total THC for cultivars ‘K4, ‘F2’, and ‘D15’ ranged by 4.7%, 5.9%, and 6.1%, respectively. Top, middle, and bottom Total THC data demonstrated that the Total THC amongst some strata were statistically different while others were comparable. The statistically different strata in the same plant could be considered different potency populations. This could be due to cannabis buds lower down the plant receiving less light due to heavy shielding from dense foliage, while the top and middle cannabis buds have better exposure to UV irradiation19. Further, it has been observed that different pruning techniques affect the chemical uniformity of the plant20,21. Between 17.8 and 55.6% of replicates throughout all strata measured fell within one of the stratum’s 99% CI. Between 26.7 and 42.2% of replicates across all plants of a cultivar batch fell within the plant’s average 99% CI. This raises a similar issue as discussed above; if 50% or less of the replicates cannot be accounted for by the 99% CI, then these are not representative of the mean. Interestingly, across the three cultivars, different strata were more representative of all measured potencies: Cultivar ‘K4’ top and bottom (both 28.9%), cultivar ‘F2’ middle (55.6%), and cultivar ‘D15’ bottom (57.8%). To determine if this analysis was adequate at detecting a difference between groups, adjusted retrospective power was calculated for cultivars ‘K4’, ‘F2’, and ‘D15’ yielding 0.99, 0.99, and 0.71, respectively. (see Supplementary Data for raw data). It is important to note that typically samples from top, middle and bottom would be mixed without consideration of this variation.
For the final analysis, different plants (n = 5) from cultivar ‘D15’ were compared against each other using pooled data from the top, middle, and bottom. A one-way ANOVA test demonstrated that the plants were statistically different, with Tukey-Kramer HSD post-hoc test suggesting plants D and E were different from plants B and C. The average potency ± 1 SD of these plants was 23.2 ± 1.3% and 23.1 ± 1.1%, and 20.4 ± 1.0% and 21.0 ± 0.7%, respectively, with a difference of 2.8% between the potency averages of the highest and lowest plants. Adjusted retrospective power was also calculated for this analysis, yielding 0.99 (see Supplementary Data for raw data). 33–66% of Total THC replicates across four plants could be accounted for by a single plant 99% CI in this dataset.
For both the top, middle, and bottom strata and plant against plant analysis, the effect sizes for the statistically significant observations were very large, however there was discordance between some statistically insignificant results and effect sizes. This demonstrates the importance of not solely relying on statistical significance as a measure of difference; effect sizes are more robust at demonstrating where there is an actual meaningful difference.
The Total THC variation is present across plants, within plants, and within a single stratum of plants. For example, the pooled mean difference between the top and bottom of cultivar ‘K4’ plants was 2.1% Total THC, and the mean difference across the plants was 1.4%.
Adjusted retrospective power analysis was used for the top, middle, and bottom and plant versus plant analysis, as no prospective sample size calculations were performed. Determining statistical power bolsters the reliability of a dataset. The authors exercise caution when interpreting retrospective power analysis and are aware of its limitations, hence adjusted retrospective power analysis was used. Adjusted retrospective power analysis makes partial corrections for the positive bias introduced into retrospective power analysis due to the use of sample estimates22. This is achieved using a probability-weighted estimate that accounts for effect size uncertainty by considering the confidence interval range and averages the power over the range of uncertainty. It considers that the difference between samples can be within the whole CI range. Such an adjustment is appropriate for small samples sizes and offers a more conservative estimate of true effect size and thus study power.
Considering the random sample sized approach (analysis 1), retrospective power analysis of 0.71–0.99 (analysis 2 & 3), and the propagation of uncertainty for Total THC measurement being ± 0.2% (see Materials & Methods for calculation), confidence can be placed in the results presented as true natural variation. Furthermore, least significant number analysis demonstrates that between 17 and 30 replicates are required to observe a significant difference between groups and therefore the extent of variation in a particular cultivar batch (see Supplementary Data for raw data). To the best of our knowledge this paper represents the first comprehensive analysis into (a) the representativeness of single value Total THC reporting as compared to larger sample sizes, (b) the extent of Total THC variation throughout and across cannabis plants in multiple commercially-relevant THC dominant cultivars, and (c) the representativeness of one plant stratum versus other plant strata and one plant versus other plants.
The data presented provides valuable insight into the nature of Total THC variation within and across cannabis plants of the same cultivar batch. It is important to be aware of this natural variance when classifying and labelling dried cannabis for both recreational and medical use. A better understanding of potency variability in the plant presents an important opportunity to better inform cannabis patients, consumers, medical professionals, and regulatory bodies. The cannabinoid and terpene synthesis pathways23, secondary metabolite storage24, and the mechanism of action by which cannabinoids act at their receptor have been well documented in the literature25. However, the cannabis consumption experience is very subjective and complex, often being attributed to the ‘entourage effect’ first described in 1998 by Ben-Shabat and colleagues26. It contemplates major cannabinoids (i.e., THC, CBD), terpenes and minor and rare cannabinoids, as well as other compounds in the cannabis plant such as flavonoids, acting synergistically to produce the intoxicating and euphoric effects reported by consumers27. These effects exist on a continuum and can vary drastically between people, much like how the capsaicin content of chilli peppers and the reported Scoville heat rating intensity and experience post-consumption can vary28. The subjective experience of dried cannabis consumption is well known and reported29,30,31, however objective cannabinoid testing outcomes (Total THC reporting) using large sample sizes and multiple cultivars has not been documented in the scientific literature. A single value reported on the label is only one of many possible values and is only representative of the mean occasionally. Although statistical analysis and effect size measures can quantify differences between groups, they do not give insight into what is deemed a meaningful difference in Total THC for consumers or regulatory bodies. However, from this dataset it can be concluded that there is no absolute value for Total THC that represents a batch and that reported Total THC can vary substantially within and across plants.